ELK 初级实践
ELK 集群的安装算是比较简单了,下面列举几个重要的参考点,方便今后查看。
1. 安装 elasticsearch
## Import the Elasticsearch PGP Key
[root@alice ~]# rpm --import https://artifacts.elastic.co/GPG-KEY-elasticsearch

## Installing from the RPM repository
[root@alice ~]# cat << EOF > /etc/yum.repos.d/elasticsearch.repo
> [elasticsearch-6.x]
> name=Elasticsearch repository for 6.x packages
> baseurl=https://artifacts.elastic.co/packages/6.x/yum
> gpgcheck=1
> gpgkey=https://artifacts.elastic.co/GPG-KEY-elasticsearch
> enabled=1
> autorefresh=1
> type=rpm-md
> EOF
[root@alice ~]# yum install elasticsearch
这种方式安装的文件分散在多个地方,如下:
/usr/share/elasticsearch        Elasticsearch home directory or $ES_HOME
/etc/elasticsearch              Configuration files including elasticsearch.yml
/etc/sysconfig/elasticsearch    Environment variables including heap size, file descriptors
/var/log/elasticsearch          Log files location
启动前需要对配置文件进行相应的修改(只列举改动的配置):
[root@alice ~]# cat /etc/elasticsearch/elasticsearch.yml
cluster.name: es-test
node.name: alice
path.data: /home/db1/es-data1,/home/db2/es-data2
path.logs: /var/log/elasticsearch
network.host: 10.0.63.202
discovery.zen.ping.unicast.hosts: ["10.0.63.202", "10.0.63.203", "10.0.63.204"]
...
[root@alice ~]# cat /etc/elasticsearch/jvm.options
-Xms32g
-Xmx32g
...
由于使用包管理器安装,因此启动很简单,systemctl enable/start elasticsearch 即可。
在多台机器上分别进行相应的配置然后启动,集群之间是自治的,不需进行任何操作。
X-Pack 提供了一些扩展功能的插件,虽然是可选项,但是一般都会进行安装:
[root@alice ~]# cd /usr/share/elasticsearch/
[root@alice elasticsearch]# bin/elasticsearch-plugin install x-pack
## 设置三个内置用户的密码,整个集群共享此处设置的密码,不需要在其他 Elasticsearch 节点进行该操作
[root@alice elasticsearch]# bin/x-pack/setup-passwords interative
2. 安装 kibana
Kibana 是用于数据展示的,而且提供了方便的查询工具。
## Installing from the RPM repository
[root@alice ~]# cat << EOF > /etc/yum.repos.d/kibana.repo
> [kibana-6.x]
> name=Kibana repository for 6.x packages
> baseurl=https://artifacts.elastic.co/packages/6.x/yum
> gpgcheck=1
> gpgkey=https://artifacts.elastic.co/GPG-KEY-elasticsearch
> enabled=1
> autorefresh=1
> type=rpm-md
> EOF
## 其实直接装就可以可以了,上面的源和 Elasticsearch 的源其实是同一个
[root@alice ~]# yum install kibana
目录结构:
/usr/share/kibana       Kibana home directory or $KIBANA_HOME
/etc/kibana             Configuration files including kibana.yml
安装 X-Pack:
[root@alice kibana]# bin/kibana-plugin install x-pack
修改 kibana 配置文件:
[root@alice kibana]# cat /etc/kibana/kibana.yml
server.port: 5601
# The URL of the Elasticsearch instance to use for all your queries.
## Kibana 目前没有访问多个后台节点的功能,如果此处配置的 elasticsearch 节点失效,Kibana 也会变为不可用
## 一种可行的方式配置多个 Kibana,并对这些 Kibana 做负载均衡方案。
elasticsearch.url: "http://10.0.63.202:9200"

## 该密码是 bin/x-pack/setup-passwords 设置的密码
elasticsearch.username: "kibana"
elasticsearch.password: "elastic"
3. 安装 Logstash
Logstash 用于集中收集数据并将数据存储到 Elasticsearch 集群中。
## GPG Key 和源与 ES 和 Kibana 相同,可直接安装
[root@bob ~]# yum install logstash
目录结构:
/usr/share/logstash     Logstash home directory or $LS_HOME
/etc/logstash           Configuration files including logstash.yml and conf.d
/var/log/logstash       Log files location
安装 X-Pack:
[root@bob ~]# cd /usr/share/logstash/
[root@bob logstash]# bin/logstash-plugin install x-pack
## Update Logstash to use the new password for the built-in logstash_system user
## 在 /etc/logstash/logstash.yml 文件中添加如下两行
xpack.monitoring.elasticsearch.username: logstash_system
xpack.monitoring.elasticsearch.password: elastic
## Logstash 提供一系列 input/filter/codec/output 插件,如果需要可以选择安装
## 如下命令列出当前所有安装的插件
[root@bob logstash]# bin/logstash-plugin list
Nginx 的配置文件中的相应的日志格式如下:
log_format  main '$remote_addr - $remote_user [$time_local] "$request" '
    '$status $body_bytes_sent "$http_referer" '
    '"$http_user_agent" "$request_time" "$ssl_protocol" "$ssl_cipher" "$http_x_forwarded_for" '
    '"$upstream_addr" "$upstream_status" "$upstream_response_length" "$upstream_response_time"';
由于线上使用 Filebeat 和 Logstash 将这些文件简单转储了一下,在上面的格式之前有多出了两个字段,即 TIMESTAMP_ISO8601 和 beat Server,从线上拿下来的日志数据格式如下:
[root@bob orange-logs]# tailf orange-api-gateway-access-2018-03-07.log
2018-03-07T23:59:59.739Z ip-172-31-34-223 45.210.181.46 - - [07/Mar/2018:23:59:59 +0000] "POST /vup/v1/whois HTTP/1.1" 200 18 "-" "okhttp/3.4.2" "0.005" "-" "-" "45.210.181.46" "172.31.32.54:10002" "200" "18" "0.003"
2018-03-07T23:59:59.739Z ip-172-31-34-223 105.112.112.200 - - [07/Mar/2018:23:59:59 +0000] "GET /cms/sms/vup/v2/2/order?index=0&count=10&status=true HTTP/1.1" 200 12 "-" "okhttp/3.4.2" "0.005" "-" "-" "105.112.112.200" "172.31.45.116:18080" "200" "2" "0.004"
2018-03-07T23:59:59.739Z ip-172-31-34-223 197.210.227.19 - - [07/Mar/2018:23:59:59 +0000] "GET /cms/vup/channels/dispark/categories HTTP/1.1" 200 32075 "-" "okhttp/3.4.2" "0.016" "-" "-" "197.210.227.19" "172.31.43.123:18080" "200" "32038" "0.015"
2018-03-07T23:59:59.739Z ip-172-31-34-223 154.160.7.56 - - [07/Mar/2018:23:59:59 +0000] "POST /cms/online/count/add HTTP/1.1" 200 13 "-" "okhttp/3.4.2" "0.009" "-" "-" "154.160.7.56" "172.31.43.123:18080" "200" "3" "0.007"
2018-03-07T23:59:59.739Z ip-172-31-34-223 197.210.227.87 - - [07/Mar/2018:23:59:59 +0000] "GET /cms/vods/recommend?index=0&count=7&channelId=697&type=0 HTTP/1.1" 200 5604 "-" "okhttp/3.4.2" "0.005" "-" "-" "197.210.227.87" "172.31.32.54:18080" "200" "5591" "0.004"
2018-03-07T23:59:59.739Z ip-172-31-34-223 154.160.2.30 - - [07/Mar/2018:23:59:59 +0000] "GET /cms/vods/recommend?index=0&count=4&channelId=680&type=0 HTTP/1.1" 200 12 "-" "okhttp/3.4.2" "0.009" "-" "-" "154.160.2.30" "172.31.45.116:18080" "200" "2" "0.008"
2018-03-07T23:59:59.739Z ip-172-31-34-223 154.160.4.82 - - [07/Mar/2018:23:59:59 +0000] "GET /cms/vup/v2/authorization/678 HTTP/1.1" 200 833 "-" "okhttp/3.4.2" "0.066" "-" "-" "154.160.4.82" "172.31.32.54:18080" "200" "821" "0.064"
2018-03-07T23:59:59.739Z ip-172-31-34-223 197.210.227.87 - - [07/Mar/2018:23:59:59 +0000] "POST /cms/online/count/add HTTP/1.1" 200 13 "-" "okhttp/3.4.2" "0.009" "-" "-" "197.210.227.87" "172.31.45.116:18080" "200" "3" "0.008"
创建 Nginx Log Pattern:
[root@bob ~]# mkdir /etc/logstash/patterns
[root@bob ~]# cat /etc/logstash/patterns/nginx_access
METHOD (OPTIONS|GET|HEAD|POST|PUT|DELETE|TRACE|CONNECT)
NGINX_ACCESS %{TIMESTAMP_ISO8601:timestamp_string} %{DATA:beat_server} %{IPORHOST:visitor_ip} - %{USERNAME:remote_user} \[%{HTTPDATE:time_local}\] "%{METHOD:method} %{URIPATHPARAM:path} HTTP/%{NUMBER:http_version}" %{INT:status} %{INT:body_bytes_sent} "%{DATA:referer}" "%{DATA:http_user_agent}" "%{NUMBER:request_time}" "%{DATA:ssl_protocol}" "%{DATA:ssl_cipher}" "%{DATA:http_x_forwarded_for}" "%{DATA:upstream_addr}" "%{DATA:upstream_status}" "%{GREEDYDATA:line}"
[root@bob ~]#
然后配置 Logstash 的 pipeline:
[root@bob ~]# cat /etc/logstash/conf.d/orange_log.conf
input {
  beats { port => "5044" }
}

filter {
  if "orange_access" in [tags] {
    grok {
      patterns_dir => "/etc/logstash/patterns"
      #match => { "message" => "%{TIMESTAMP_ISO8601:timestamp_string} %{DATA:data_from} %{IPORHOST:visitor_ip} - %{USERNAME:remote_user} \[%{HTTPDATE:timelocal}\] \"%{METHOD:method} %{URIPATHPARAM:path} HTTP/%{NUMBER:http_version}\" %{INT:status} %{INT:body_bytes_send} \"%{DATA:referer}\" \"%{DATA:http_user_agent}\" \"%{NUMBER:request_time}\" \"%{DATA:ssl_protocol}\" \"%{DATA:ssl_cipher}\" \"%{DATA:http_x_forwarded_for}\" \"%{DATA:upstream_addr}\" \"%{DATA:upstream_status}\"%{SPACE}%{GREEDYDATA:line}" }
      match => { "message" => "%{NGINX_ACCESS}" }
      add_field => {
        "type" => "orange_access"
      }
    }

    if "_grokparsefailure" in [tags] {
      drop { }
    }

    date {
      match => ["timestamp_string", "ISO8601"]
    }

    geoip {
      source => "visitor_ip"
    }

    mutate {
      convert => {
        "status" => "integer"
        "upstream_status" => "integer"
        "body_bytes_sent" => "integer"
        "request_time" => "float"
      }
      remove_field => [message, timestamp_string, host, line, timelocal, beat, offset, tags]
    }
  }
}

output {
  elasticsearch {
    hosts => ["10.0.63.203:9200"]
    user => elastic
    password => "elastic"
    index => "helloword-%{+YYYY.MM.dd}"
    document_type => "%{type}"
  }
  stdout { codec => rubydebug }
}
[root@bob ~]#
启动 => systemctl start logstash
然后使用 Filebeat 将文件喂给 Logstash, Logstash 的 pipeline 会在 output 阶段将数据存储到 Elasticsearch。
Filebeat 的安装和使用比较简单了,下面只列出其配置文件:
- type: log

  # Change to true to enable this prospector configuration.
  enabled: true

  # Paths that should be crawled and fetched. Glob based paths.
  paths:
    - /root/orange-logs/*.log
  tags: ["orange_access"]

output.logstash:
  # The Logstash hosts
  hosts: ["localhost:5044"]
这里有一个小 Tip,假如为了测试需要将 Filebeat 配置的数据源重新加载,如下操作可能会帮到你:
[root@bob filebeat]# pwd
/var/lib/filebeat
[root@bob filebeat]# systemctl stop filebeat
[root@bob filebeat]# mv registry registry.old
[root@bob filebeat]# systemctl start filebeat
2018-03-27 更新
在使用 Kibana 生成地图相关视图的时候,发现上面 geoip 生成的数据类型不是 geo_point,而是:
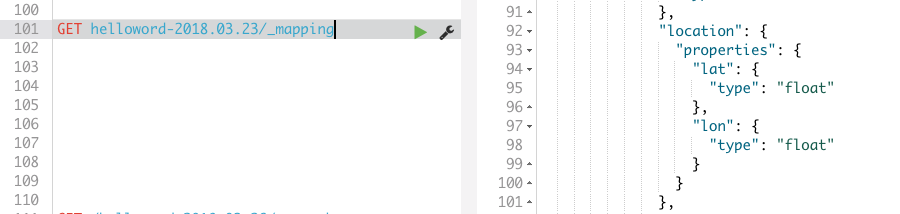
解决这一问题的方法就是修改相关 index 的 _mapping:
PUT _template/helloworld
{
  "index_patterns": "helloword-*",
  "mappings": {
    "orange_access": {
      "dynamic": "true",
      "properties": {
        "geoip": {
          "dynamic": true,
          "properties": {
            "location": {
              "type": "geo_point"
            }
          }
        }
      }
    }
  }
}
通过上面的操作,可以让新生成 index 的 _mapping 中 geo_location 的类型为 geo_point:

但是已经存在的 index 的 _mapping 并不能改变,我们可以将 index 删除然后重新将日志导入,但更快的方式是使用 _reindex:
// 该过程可能耗时较长,可以使用 GET 查看 reindex 是否已经完成
POST _reindex
{
  "source": {
    "index": "helloword-2018.03.23"
  },
  "dest": {
    "index": "helloword-2018.03.23-new"
  }
}

// 当 reindex 过程完成,就可以将旧的 index 删除
DELETE helloword-2018.03.23